 Data Science
Pandas: How to Pivot data
This article is part of a series of practical guides for using the Python data processing library pandas. To see view all the available parts, click here.
When I was starting out with pandas, I was coming from an Excel and SQL background. Having spent a solid 8 years with Excel as my primary data munging and modeling tool, I was very comfortable using pivot tables, a tool I found extremely powerful and later discovered are strangely controversial. My workflow started to involve pivot tables so regularly that my SQL queries were often written to extract data in a format that would make it simpler to aggregate in a pivot table.
Naturally, when I started learning pandas, one of the first things I wanted to learn was “how can I recreate the functionality of an Excel pivot table in pandas”? In this guide we will look at several ways to do just that.
Reading in a dataset
If you don’t have a dataset you want to play around with, University of California Irvine has an excellent online repository of datasets that you can play with. For this explainer we are going to be using the Wine Quality dataset. If you want to follow along, you can import the dataset as follows:
import pandas as pd

df = pd.read_csv("https://archive.ics.uci.edu/ml/machine-learning-databases/wine-quality/winequality-red.csv", sep=';')
Add some categorical features
As we are pivoting the data, we need a couple of extra categorical variables. We can create these by ‘binning’ or grouping up a couple of our numerical columns:
labels = ["low", "medium low", "medium", "medium high", "high"]
df["binned alcohol"] = pd.qcut(df['alcohol'], q=5, labels=labels)
df.groupby("binned alcohol")["alcohol"].count()

bins = [0, 1.5, 2, 2.5, 3, 16]
labels = ["{:.1f}g-{:.1f}g".format(x, y) for x, y in zip(bins, bins[1:])]
df["binned residual sugar"] = pd.cut(df['residual sugar'], bins=bins, labels=labels)
df.groupby("binned residual sugar")["residual sugar"].count()
In the code we create binned columns for two numerical columns, alcohol and residual sugar, and we do the binning two different ways:
qcut: Groups the values in bins based on quantiles. In this case we specify 5 bins (i.e. quintiles).cut: Groups the values in bins based on values we specify.
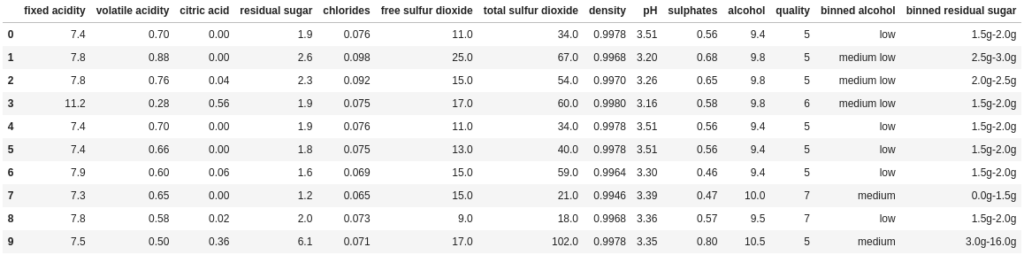
The end result is we get a DataFrame that looks as follows (obviously this is just the first 10 rows):
The manual way to pivot
Being the old fashioned guy that I am, we are going to start with learning how to pivot data using a combination of basic methods. The advantage of knowing this ‘manual way’ of pivoting the data is it can give you a greater level of control when you need to do something a little tricky or handle an edge case that isn’t covered by the convenience wrapper methods we will look at later.
The good news is that the manual way is, in itself, fairly simple. In essence, we are combining methods covered in previous guides (groupby and set_index) with a new method called unstack to pivot up your data any way you want.
With aggregation
The typical scenario where you want to pivot up some data involves aggregation. You have a bunch of data points and you want to create a table of sums or averages (or 91st quantiles) by two or more categorical variables. Let’s take a look:
df.groupby(["quality", "binned alcohol"])["fixed acidity"].sum().unstack("quality")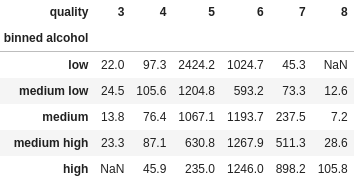
Let’s dissect this a little. First, for those that have read the aggregation guide, you will recognize everything up to unstack is a simple aggregation. In fact, let’s drop the unstack and look at the results:
df.groupby(["quality", "binned alcohol"])["fixed acidity"].sum()

quality  binned alcohol
3        low                 22.0
         medium low          24.5
         medium              13.8
         medium high         23.3
         high                 NaN
4        low                 97.3
         medium low         105.6
         medium              76.4
         medium high         87.1
         high                45.9
5        low               2424.2
         medium low        1204.8
         medium            1067.1
         medium high        630.8
         high               235.0
6        low               1024.7
         medium low         593.2
         medium            1193.7
         medium high       1267.9
         high              1246.0
7        low                 45.3
         medium low          73.3
         medium             237.5
         medium high        511.3
         high               898.2
8        low                  NaN
         medium low          12.6
         medium               7.2
         medium high         28.6
         high               105.8
Name: fixed acidity, dtype: float64
From this, all we are doing is calling the unstack method. What unstack does is takes a specified index column (quality in our example above), and converts each value in that index into its own column. That’s it! We can change which columns we groupby, we can change the type of aggregation (or do multiple aggregations), we can change which column or columns we unstack (pass them as a list if there is more than one), it’s all completely flexible.
In short, the basic steps are:
groupbyall the columns you want as rows or columns in your pivot table.aggregatethe column you want as the values in the pivot table.unstackthe the index column or columns for which you want to have the categories as columns.
Here is a another example showing the use of some more complex options:
df.groupby(["quality", "binned alcohol", "binned residual sugar"])["fixed acidity"].agg(["sum", "mean"]).unstack("binned alcohol")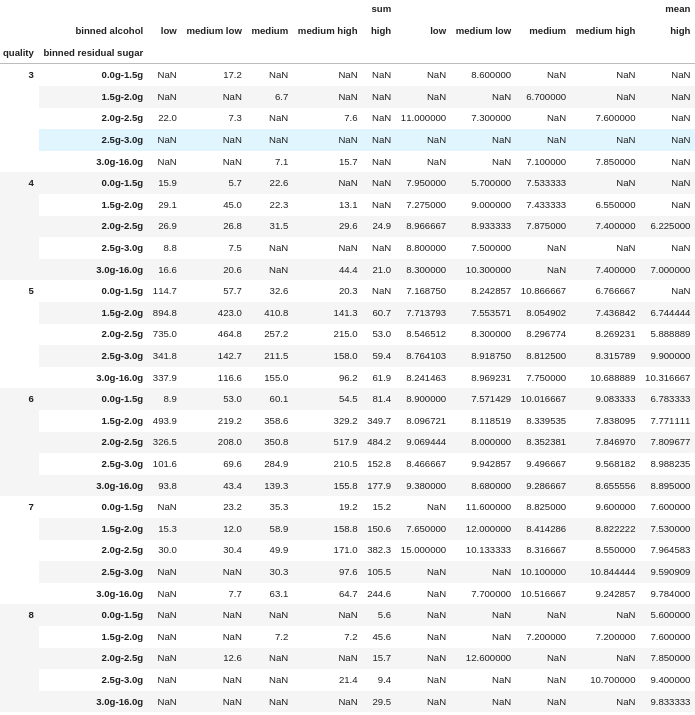
Without aggregation
What if we already have aggregated data? What if we were starting with data that looked like this:
df_agg = df.groupby(["quality", "binned alcohol", "binned residual sugar"])["fixed acidity"].agg(["count", "sum", "mean"]).fillna(0).reset_index()
df_agg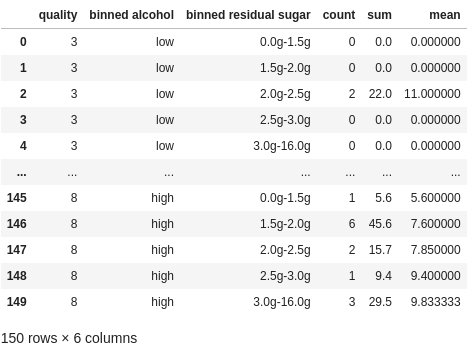
Technically, we could do the same as above using groupby. Because every row already represents a unique combination of quality, binned alcohol and binned residual sugar, aggregating by the same columns again will not change the values. There is a better way though.
In essence, what we need for unstack to work is to have the values we want to unstack in the index of the DataFrame. groupby does that as a by product of aggregation, but we can also do it directly using set_index:
df_agg.set_index(["quality", "binned alcohol", "binned residual sugar"])["mean"].unstack(["binned alcohol"])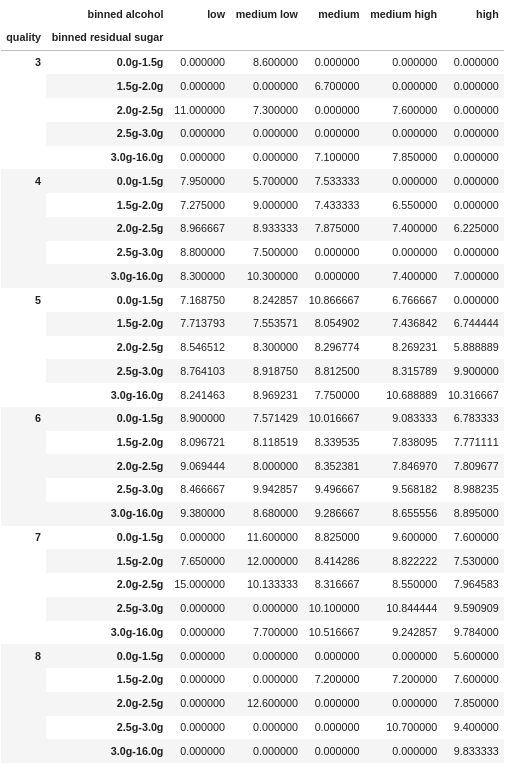
The pivot method
Let’s take a look at the first of our convenience wrappers, the pivot method. This method is a one shot way of doing what we did in the previous section with set_index: pivoting an already aggregated DataFrame. So instead of using set_index, specifying a column (or multiple columns) and then calling unstack, we can do it all in one method.
What we need to do is provide three parameters to the pivot method:
index: the names of the columns to have as the index (i.e. row) values.columns: the names of the columns to have as the column values.values: the names of the columns that contain the values we are interested in.
Here is an example, again starting with the already aggregated DataFrame df_agg from earlier:
df_agg.pivot(index=["quality", "binned residual sugar"], columns="binned alcohol", values="mean")Two important notes on the pivot method:
- You cannot use
pivotto aggregate your data, the data must already be aggregated. If you try to use this method with unaggregated data you will get an error that says something likeValueError: Index contains duplicate entries, cannot reshape. - The
valuesparameter is optional. If you don’t provide avaluesparameter, it will pivot up all the other columns in the DataFrame.
The pivot_table method
If pivot is the equivalent of df.set_index(["A", "B"]).unstack("B"), pivot_table is the equivalent of df.groupby(["A", "B"]).agg().unstack("B"). That is, we can use pivot_table when we need to aggregate before pivoting the data.
pivot_table also takes a slightly different form than pivot. pivot is a method of the DataFrame class – that’s why we can do df.pivot() and we don’t need to tell it which data to use. pivot_table is a standalone function in the pandas library, which means we call it using pd.pivot_table(), assuming you specified to import pandas as pd. The three parameters we used for the pivot method (index, columns and values) are the same in pivot_table, but pivot_table being a function means we also have to pass a DataFrame to the function using the data parameter.
If all of this is a bit confusing, don’t worry, understanding the difference between functions and methods is not required knowledge in order to use them, it just helps to understand why they work a little different.
Let’s look at an example that recreates the first aggregation example from above:
pd.pivot_table(data=df, index="binned alcohol", columns="quality", values="fixed acidity", aggfunc="sum")As you can see, this example is easier to read and understand than our first example, and yet maintains much the same flexibility. We can pass multiple columns to any of the index, columns or values parameters (pass them as a list if you have more than one). We can also specify complex aggregations by passing a list or dictionary to the aggfunc parameter, just as we did in the advanced aggregation guide with the agg method.
All in all, a very handy convenience wrapper, and now having written this guide, probably something I should have been using a long time ago.
The crosstab method
crosstab is a similar method to pivot_table but is, in a way, more generalized. Again it is a function of the pandas library, so we call it using pd.crosstab() and have to pass it the data. And again we have parameters called index, columns and values. However, for crosstab we don’t have a data parameter to pass a DataFrame. Instead, we pass actual columns of data to the index, columns and values parameters. So, to again reproduce the results from our first example, we would do something like:
pd.crosstab(index=df["binned alcohol"], columns=df["quality"], values=df['fixed acidity'], aggfunc="sum")Obviously, this is not as nice and clean as the pivot_table function, but that is because in our example we already have our data in a DataFrame. In practice, crosstab is a function to keep in mind when you don’t have a DataFrame, but instead have lists of values that you want to… ah… cross-tabulate. You could convert your lists of values into a DataFrame first and still use pivot_table, but if you are only interested in the aggregated results, crosstab is a nice way to cut out the extra step.
Wrapping Up
In this guide we looked at a range of ways to recreate the functionality of an Excel pivot table in pandas. We started pivoting data the manual way using methods like groupby, set_index and unstack. Then we looked at the comparable convenience methods and functions, pivot, pivot_table and crosstab.
All of these methods/functions have situations where they will be the better option, and now that you know about them, you are better positioned to choose the best option for a given scenario.