 Data Science
Pandas: Aggregation
This article is part of a series of practical guides for using the Python data processing library pandas. To see view all the available parts, click here.
A fundamental tool for working in pandas and with tabular data more generally is the ability to aggregate data across rows. Thankfully pandas gives us some easy-to-use methods for aggregation, which includes a range of summary statistics such as sums, min and max values, means and medians, variances and standard deviations, or even quantiles. In this guide we will walk through the basics of aggregation in pandas, hopefully giving you the basic building blocks to go on to more complex aggregations.
Reading in a dataset
If you don’t have a dataset you want to play around with, University of California Irvine has an excellent online repository of datasets that you can play with. For this explainer we are going to be using the Wine Quality dataset. If you want to follow along, you can import the dataset as follows:
import pandas as pd

df = pd.read_csv("https://archive.ics.uci.edu/ml/machine-learning-databases/wine-quality/winequality-red.csv", sep=';')
Aggregation Methods
Let’s start with the basics – what aggregation methods are available by default? Below are some of the most common ones you are likely to encounter:
count()– the number of rows in a columnnunique()– the number of unique values in a columnsum()– the sum of the values in a columnmean()– the arithmetic mean of the values in a columnmin()/max()– the smallest/largest value in a columnstd(ddof=1)/var(ddof=1)– the standard deviation / variance of the values in a column. Defaults to the sample formulation (divided by n – 1), but you can setddofto 0 for the population formulation (divided by n).quantile(q=0.5)– get the qth quantile for a column. Defaults to the 50th quantile (i.e. the median).median()– the median, or the 50th quantile of a column.
Of course this is only a subset of the available options. For the full list of available aggregations, check the official documentation.
Basic Aggregation
The way we use the above functions is by calling them on a DataFrame or a Series (i.e. a column of a DataFrame). If we call an aggregation method on a DataFrame, we will get a Series with the aggregated value for each column in the DataFrame:
df.sum()

fixed acidity           13303.10000
volatile acidity          843.98500
citric acid               433.29000
residual sugar           4059.55000
chlorides                 139.85900
free sulfur dioxide     25384.00000
total sulfur dioxide    74302.00000
density                  1593.79794
pH                       5294.47000
sulphates                1052.38000
alcohol                 16666.35000
quality                  9012.00000
dtype: float64
In practice however, it is more common that we will want to aggregate the values in a specific column, which will return just a single value:
df['fixed acidity'].sum()

13303.1
A note on data types: in almost all cases these aggregation functions are intended to be used for numeric data. If you try to aggregate a Series with non-numeric data, it will typically cause an error. However, if you aggregate over a DataFrame which has both numeric and non-numeric data, the non-numeric columns will just be ignored.
Using groupby
More often than not when doing aggregation, you are not going to be aggregating over a whole DataFrame or column, you will want to aggregate by some categorical value. For example, what are the average sales by country? This is where the groupby method comes in.
groupby allows us to specify a column (or multiple columns) to aggregate the values by, and it is used as follows:
df.groupby("quality").mean()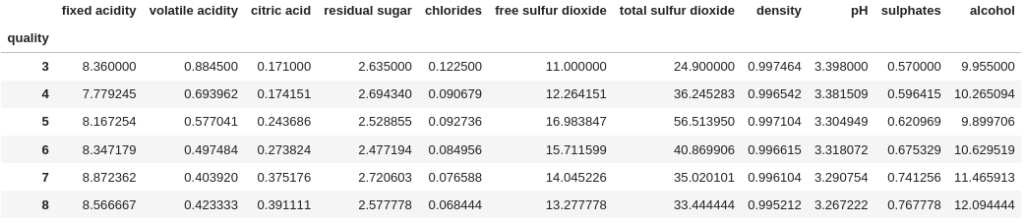
If you want to group by multiple columns, instead of passing just one column name, we can pass a list of columns to group by:
df.groupby(["quality", "residual sugar"]).mean()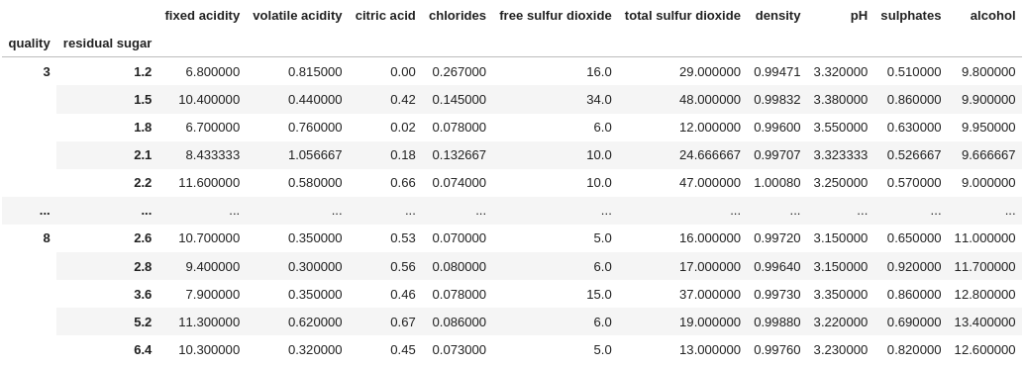
As we did with the simple aggregation, we can also limit the aggregation to a specific column (or list of columns) by passing the column or columns we want to aggregate after the groupby method:
df.groupby(["quality", "residual sugar"])["alcohol"].mean()

quality  residual sugar
3        1.2                9.800000
         1.5                9.900000
         1.8                9.950000
         2.1                9.666667
         2.2                9.000000
                             ...
8        2.6               11.000000
         2.8               11.700000
         3.6               12.800000
         5.2               13.400000
         6.4               12.600000
Name: alcohol, Length: 207, dtype: float64
Finally, a neat trick that took me waaaay too long to learn is the as_index parameter. You will notice that in all of the above examples, the values that we group by get put into the index of the results. Setting the as_index parameter to False will keep the group values in columns:
df.groupby("quality", as_index=False).mean()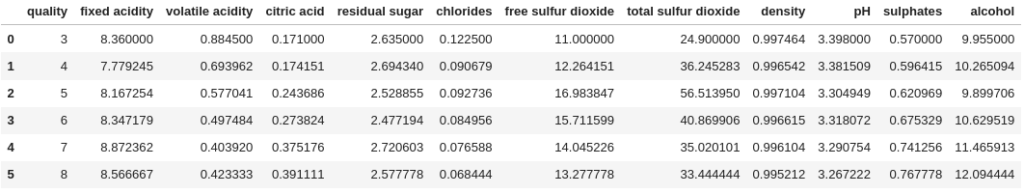
Understanding DataFrameGroupBy Objects
This section is not required to understand how to do aggregation, but is more to help build understanding of what the groupby method is doing. It all comes from a simple question: “what does the groupby method produce before we chain on some aggregation method?” Let’s take a look:
grouped = df.groupby("quality")
print(grouped)

<pandas.core.groupby.generic.DataFrameGroupBy object at 0x7f7c34cc3550>
So groupby produces a DataFrameGroupBy object. Although this is a different object to a DataFrame, we can still use many methods we would use on a DataFrame. For example, we can use the describe method and it now gives us summary stats for each group:
grouped.describe()["fixed acidity"]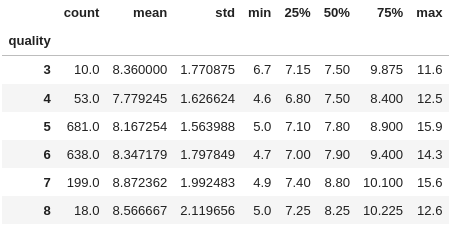
head also works and now returns the top 5 rows for each group.
What else can we do with this object? Well, we can look at the groups using the groups attribute:
grouped.groups

{3: [459, 517, 690, 832, 899, 1299, 1374, 1469, 1478, 1505],
...,
8: [267, 278, 390, 440, 455, 481, 495, 498, 588, 828, 1061, 1090, 1120, 1202, 1269, 1403, 1449, 1549]}
This gives us the lists of indices for each group. If you have read the filtering and segmenting guide, you may remember that with a list of indices, we can filter out a selection of rows from a DataFrame:
df.loc[grouped.groups[3]]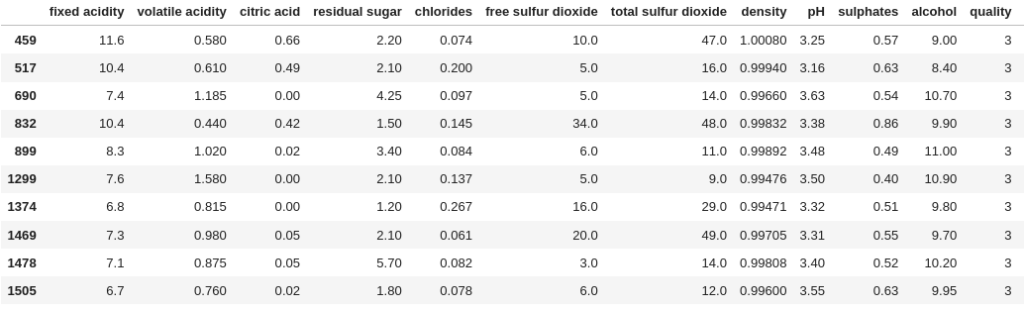
Of course, if you did read the filtering and segmenting guide, you probably also know there is a simpler way to extract a subset of rows like this. However, there are other scenarios where you might want to work with the grouped indices from the DataFrameGroupBy object directly. Additionally, understanding the structure of an object you are working with is never a bad thing.
Wrapping Up
In this guide we looked at the basics of aggregating in pandas. We looked at basic aggregation and some of the common methods for aggregation. We then looked at how to use groupby to aggregate values by some criteria. Finally, we looked at what the groupby method produces, and how it can be used directly.
All these steps are building blocks to doing more complicated aggregations, which we will look at in the Advanced Aggregations guide.