 Data Science
Pandas: Advanced Aggregation
This article is part of a series of practical guides for using the Python data processing library pandas. To see view all the available parts, click here.
Building on the basic aggregation guide, in this guide we will look at some more advanced ways we can aggregate data using pandas. We are going to cover three techniques:
- Aggregating using different methods at the same time, for example, summing one column and taking the average of another.
- Defining and using custom aggregation functions which we can use to calculate aggregates that are not available “out of the box”.
- The
transformmethod which can be used to do some very useful things with aggregated values.
Reading in a dataset
If you don’t have a dataset you want to play around with, University of California Irvine has an excellent online repository of datasets that you can play with. For this explainer we are going to be using the Wine Quality dataset. If you want to follow along, you can import the dataset as follows:
import pandas as pd

df = pd.read_csv("https://archive.ics.uci.edu/ml/machine-learning-databases/wine-quality/winequality-red.csv", sep=';')
Multiple Aggregation Methods
Back in the basic aggregation guide, we looked at how we can apply an aggregation method, like sum(), to a DataFrame or a single column in a DataFrame (i.e. a Series). Extending that, what if we want to sum one column and take an average of another? What if we want to take an average and a standard deviation for the same column? What if we want to do all those things at the same time? The answer is the agg() method – an alias for the aggregate() method.
The agg() method replaces a single aggregation method call and allows us to specify which columns we want to aggregate and the methods to use. There are multiple ways we can do this.
Multiple methods – All columns
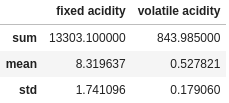
If we have one or more columns we want to aggregate and have multiple methods we would like to apply to all columns, then we can specify the methods as a list:
df.agg(["sum", "mean", "std"])

sum     13303.100000
mean        8.319637
std         1.741096
Name: fixed acidity, dtype: float64
Multiple Methods – Specific Columns
If we want to apply multiple aggregations to specific columns only, there are two ways to handle to do this. Firstly, as we did before, we can specify the columns to apply the aggregation methods to before we do the aggregation:
df[["fixed acidity", "volatile acidity"]].agg(["sum", "mean", "std"])
Or we can specify the columns in the agg function itself using a dictionary format:
df.agg({
    "fixed acidity": ["sum", "mean", "std"],
    "volatile acidity": ["sum", "mean", "std"]
})
Multiple Methods with a groupby
When we add a groupby clause to the mix, the format of our results changes:
df.groupby("quality").agg({
    "fixed acidity": ["sum", "mean", "std"],
    "volatile acidity": ["sum", "mean", "std"]
})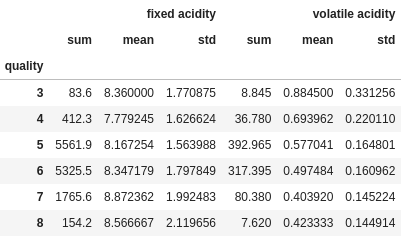
You will notice that the column names have been put on two levels. This is called a MultiIndex and works a little differently. This is looked at in more detail in another guide, but here are a couple of quick tips:
df["fixed acidity"]will now return a DataFrame with the three columns underfixed acidity.df[("fixed acidity", "sum")]will select the specificfixed aciditysum column.- If you just want to flatten the index into one level, you can do the following:
df_grouped.columns = df_grouped.columns.to_flat_index()
df_grouped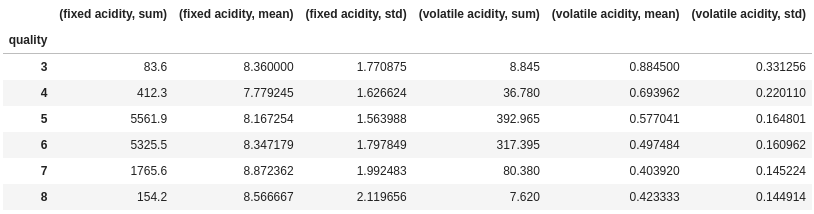
Specific Methods – Different Methods
As you may have guessed from the previous example, if we use a dictionary to specify the aggregations, there is nothing to stop us from specifying different aggregations for different columns:
df.groupby("quality").agg({
    "fixed acidity": "sum",
    "volatile acidity": ["mean", "std"]
})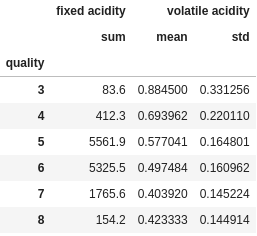
If you specific only one aggregation for each column, note that it will not create a MultiIndex anymore, instead it will just retain the original column names.
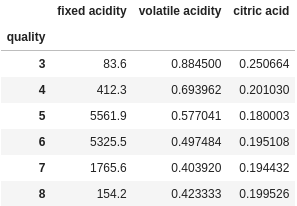
df.groupby("quality").agg({
    "fixed acidity": "sum",
    "volatile acidity": "mean",
    "citric acid": "std"
})
Named Aggregations
Finally, we can use a special class of object called NamedAgg to specify our own custom column names as we aggregate:
df.groupby("quality").agg(
    min_fa=pd.NamedAgg(column="fixed acidity", aggfunc="min"),
    var_va=pd.NamedAgg(column="volatile acidity", aggfunc="var")
)
This is obviously pretty useful and cool, but it does look a little clunky, having to create this NamedAgg object for every aggregate. Well, as this clever guy worked out, you don’t need to actually specify the object, pandas is smart enough to work it out if you just pass it a tuple:
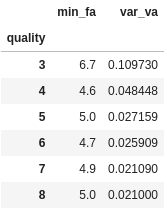
df.groupby("quality").agg(
    min_fa=("fixed acidity", "min"),
    var_va=("volatile acidity", "var")
)
Custom Aggregations
In addition to using the default aggregation functions provided in pandas/numpy, we can also create out own aggregation functions and call them using agg.
To make a custom aggregation function, all we need to do is create a function that intakes a Series (or list) and returns a single number. No need to worry about grouping, the groupby function will call your function for each group separately. Let’s start off with a basic one:
def field_range(s):
    return max(s) - min(s)
Using basic python functions that operate on lists, we can easily create a aggregation function that is going to return the range of the values in the inputted Series. Let’s test it out:
df.groupby("quality")["fixed acidity"].agg(["min", "max", field_range])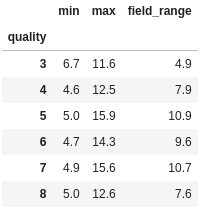
Extracting the min and max for the column in addition to our field range aggregate, we can confirm that our function is working as expected. Note in the code above that for the default pandas aggregation methods, we put the names in quotes (“”), whereas for our custom function, we pass the actual function.
Now let’s step it up a little with a function that might be useful at some point: the harmonic mean. The harmonic mean is a alternative way of calculating the mean of a set of values that is often more appropriate when dealing with rates of change and ratios (this example involving speeds helps explain why).
Let’s create a function that will return the harmonic mean of a Series, then use it to compare to the arithmetic mean (i.e. the one everyone usually thinks of as the mean):
def harmonic_mean(s):
    return len(s) / sum([1/x for x in s])

df.groupby("quality")["fixed acidity"].agg(["mean", harmonic_mean])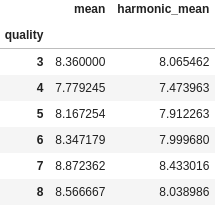
Everything looks as expected. For all positive data sets containing at least one pair of nonequal values, the harmonic mean is expected to be smallest of the three Pythagorean means (the geometric mean being the 3rd one). In our case, we see that for each group the harmonic mean is close to, but always less than, the arithmetic mean.
Transform
When I first set out to write these pandas guides, one of the first things on my list of things to cover was the transform method. We all learn in different ways and in different orders, but for me the transform method was one I discovered relatively late on, and is also one that would have saved me a lot of time if I knew about it earlier.
OK, so what does it do? transform is the method to use when you want aggregated values without aggregating your DataFrame/Series.
Let’s consider an example. From your full list of wines, you want to standardize the values in the residual sugar column so that the lowest value is 0 and the highest value is 1. We could do something like this:
df["standardized_sugar"] = (df["residual sugar"] - df["residual sugar"].min()) / (df["residual sugar"].max() - df["residual sugar"].min())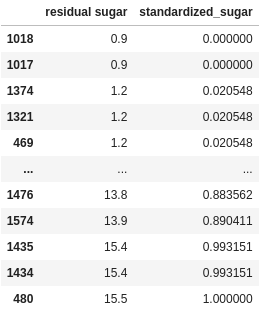
So far so good. We could use transform do the above, but it isn’t really going to save us much time.
Now, let’s imagine we want to do the above calculation, but now we want to do the standardization based on the max and min residual sugar values for each quality rating. Here is how I would have done this before transform:
min_values = df.groupby("quality", as_index=False).agg(sugar_min=("residual sugar", "min"))
max_values = df.groupby("quality", as_index=False).agg(sugar_max=("residual sugar", "max"))
df = df.merge(min_values, how="left", on="quality")
df = df.merge(max_values, how="left", on="quality")
df["group_standardized_sugar"] = (df["residual sugar"] - df["sugar_min"]) / (df["sugar_max"] - df["sugar_min"])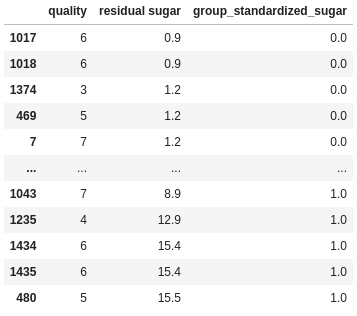
I do two aggregations to get the min and max values for each group. I then merge (i.e. join) those aggregated DataFrames back to the original DataFrame, joining on quality, then I do the standardization calculation.
If you remember back to the start, I described transform as what you use “when you want aggregated values without aggregating your DataFrame/Series”. This is what I was getting at. In the example above, I have aggregated some values, then I have to join the aggregated values back to the original DataFrame so I could use them to do the calculation.
Instead of doing those two separate steps, we can instead use transform:
min_values = df.groupby("quality")["residual sugar"].transform("min")
max_values = df.groupby("quality")["residual sugar"].transform("max")
df["group_standardized_sugar"] = (df["residual sugar"] - min_values) / (max_values - min_values)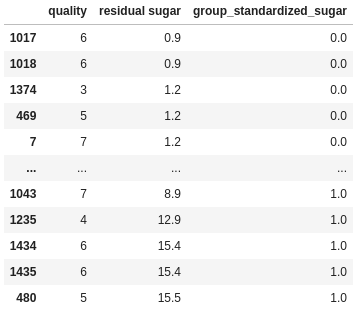
As can be seen, the transform method does both the aggregation and the merge. It takes an aggregated value and repeats it for every row in the original DataFrame. If you use groupby, the aggregated value for a group will be repeated for every row in that group. This cuts out a whole, often time consuming step and makes the code far more concise.
Wrapping Up
Building on the basic aggregation guide, in this guide we looked at three advanced techniques you can use when aggregating.
First we looked at how we can use multiple aggregation methods at the same time, allowing us to create complex aggregations with relatively concise and easy to follow code. We then we looked at how we can create custom functions to use when aggregating. While you may not need to use a custom aggregation very often, this can prove to be very useful in niche situations. Finally, we looked at transform, a powerful tool for when you need to perform a calculation involving individual values and aggregate values.
Combined together these advanced techniques should help you to have the confidence to complete almost any aggregation you need in pandas.